Computational Analysis of Social Complexity
Fall 2026, Spencer Lyon
Prerequisites
Graph theory (weeks 3-4)
Game theory basics (week 8)
Outcomes
Define multisided platforms and distinguish same-side and cross-side network effects
Explain fulfilled-expectations equilibrium and critical mass
Compute and classify equilibria of a network-effects demand model in Julia
Connect platform pricing puzzles to cross-side externalities
References
Easley and Kleinberg, Chapter 17: Network Effects (required)
Katz and Shapiro (1985), Network Externalities, Competition, and Compatibility
Matchmakers (Evans and Schmalensee, 2016), Chapters 1-3 (optional extra reading)
Dinner, a Card, and a 7% Fee
In 1950, Diners Club launched what became the first credit card
The pitch linked two groups that needed one another:
Diners wanted to eat without carrying cash
Restaurants wanted diners who would spend
Diners received the card for roughly free
Participating restaurants paid Diners Club about 7% of each bill
That sounds backward at first: why charge the businesses that make the service possible?
Three Pricing Puzzles
Why is your credit card free—or even pays rewards—while merchants pay roughly 2-3%?
Why is OpenTable free for diners while restaurants pay?
Why would a nightclub offer a Ladies Night discount to one group?
These are not three unrelated marketing tricks
By the end of this unit, we will see that they are versions of the same formula
Our Four-Lecture Map
Today: platforms, network effects, and critical mass
Ignition: Chicken-and-Egg, Lock-In, and Tipping: tipping, the chicken-and-egg problem, and competition between platforms
Platform Pricing: Who Pays, Who Gets Paid: multihoming and why price structure matters separately from price level
Matching Markets: When Prices Can’t Do the Job: stable matching and the pairs that can unravel an assignment—a blocking pair
Our common question: how does an intermediary get the right participants together?
What Is a Platform?
A pipe creates value by transforming inputs into outputs
A bakery turns flour, labor, and ovens into bread
Value moves mostly along one production chain
A platform creates value by connecting two or more groups
The platform is a matchmaker
Each group joins partly because the other group is there
The distinction is about the source of value—not whether the business owns servers or has an app
This figure lays the two value-creation logics side by side
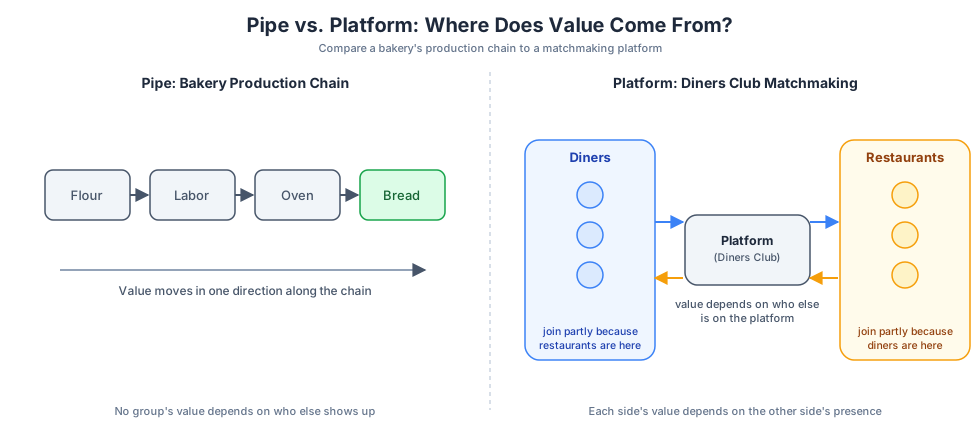
Figure 1:A pipe’s bakery turns flour, labor, and ovens into bread along one chain, so no participant’s value depends on who else shows up. A platform’s value instead comes from matchmaking: Diners Club’s card is valuable to diners because restaurants accept it, and valuable to restaurants because diners carry it.
Matchmakers in the Wild
Read each row from left to right: who needs whom?
| Platform | Side A | Side B | What the platform coordinates |
|---|---|---|---|
| Credit cards | Cardholders | Merchants | Payment acceptance |
| OpenTable | Diners | Restaurants | Reservations and empty tables |
| Ride-share | Riders | Drivers | Trips in a place and time |
| Ad-supported media | Readers | Advertisers | Attention and messages |
| App stores | Users | Developers | Software discovery and distribution |
A platform can operate pipes too, but matchmaking is the economic engine
Exercise 1: Pipe or Platform?
Classify three more businesses: a grocery store, a dating app, and a video-game console
For each one:
Is its main value created like a pipe, a platform, or both?
If it is a platform, name the sides
What does one side gain when the other side grows?
Be ready to defend one classification that could reasonably go either way
When the Network Is Part of the Product
Recall homophily and tie strength from weeks 3-4
There, network structure shaped individual behavior
Now the size of the network is part of the product itself
A network effect occurs when one participant changes another participant’s value from joining
We need to ask two questions:
Are the participants on the same side or opposite sides?
Does another participant create a positive or negative effect?
Same-Side Network Effects
Same-side network effects run among participants in the same group
They can be positive:
More gamers make a multiplayer game more fun
More colleagues on a messaging service make it more useful
They can be negative:
More riders requesting trips at once create congestion and longer waits
More drivers compete for the same set of fares
More is not automatically better—even on a network
Cross-Side Network Effects
Cross-side network effects run from one group to another
More ride-share drivers usually improve the service for riders
More riders create more earning opportunities for drivers
More merchants make a credit card useful to cardholders
More cardholders make acceptance valuable to merchants
The feedback can reinforce itself: side A attracts side B, which attracts still more of side A
The diagram below sketches these four effects as a blank template—Exercise 2 asks you to label each sign
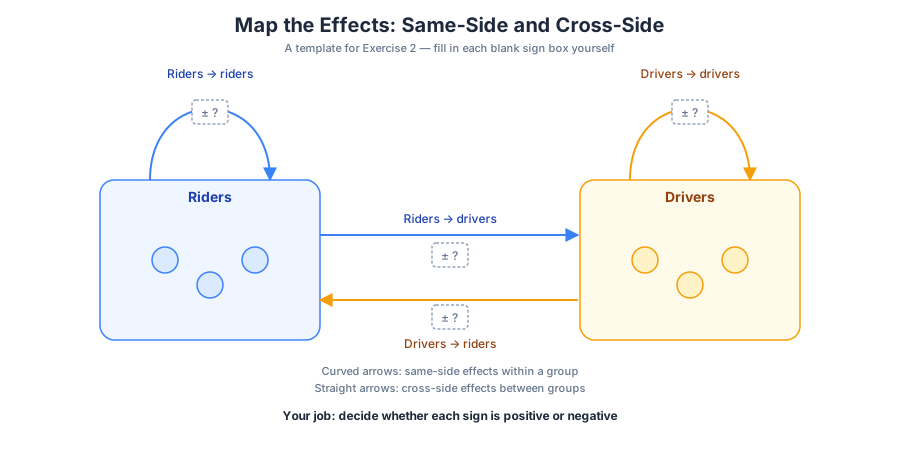
Figure 2:A template for Exercise 2: curved arrows mark same-side effects within a group, straight arrows mark cross-side effects between groups, and every sign box is left blank for you to fill in.
Exercise 2: Trace the Effects
Consider a ride-share platform
Draw one arrow for each effect and label it positive or negative:
Riders riders
Drivers drivers
Riders drivers
Drivers riders
Which effect changes sign when a city moves from a quiet afternoon to bar-closing time?
Which effects can the platform influence with prices?
Expectations Can Create Demand
Suppose a new network product launches today
Would you join if you expected nobody else to join?
Would you join if you expected almost everyone else to join?
The product and price did not change—only your expectation did
Katz and Shapiro call this a fulfilled-expectations problem:
Expectations determine adoption
Adoption then confirms or contradicts those expectations
Consumers First, Equations Second
Consumers differ in taste for the product
Index consumers by , uniformly distributed on
Let be the network size consumers expect
Let be the value created by a network of that expected size
A consumer with taste is willing to pay
High- consumers value the product more; everyone values a stronger network more
From a Joining Rule to Demand
At price , consumer joins when
The marginal consumer has
Because is uniform on , the share above is realized adoption
Expected adoption goes in; realized adoption comes out
using Plots
using Random
using LaTeXStrings

Random.seed!(6318)
default(; linewidth=3, size=(760, 450), legend=:best)
# Network value is positive even before the network grows
network_value(n; a=0.1, b=1.0) = a + b * n
function realized_adoption(n_expected, p; a=0.1, b=1.0)
value = network_value(n_expected; a=a, b=b)
return clamp(1 - p / value, 0.0, 1.0)
end
a, b, p = 0.1, 1.0, 0.2
g(n_expected) = realized_adoption(n_expected, p; a=a, b=b)g (generic function with 1 method)Expectations Versus Outcomes
The curved line asks: if consumers expect , how many actually join?
The 45-degree line asks: where does realized adoption equal expected adoption?
Before looking at the plot, make a prediction:
How many intersections will there be?
Will pessimistic and optimistic beliefs lead to the same outcome?
n_grid = range(0.0, 1.0; length=1001)

plot(
    n_grid, g.(n_grid);
    label=L"g(n^e; p)",
    xlabel=L"Expected network size, $n^e$",
    ylabel=L"Realized adoption, $n$",
    xlims=(0, 1),
    ylims=(0, 1),
    title="Fulfilled expectations at p = $p",
)
plot!(n_grid, n_grid; label=L"45^\circ: n=n^e", linestyle=:dash, color=:black)Fulfilled-Expectations Equilibrium
An equilibrium occurs when expectations are fulfilled
In symbols, expected size and realized size agree:
This looks like the Nash equilibrium logic from week 8
Each consumer responds optimally to a belief about everyone else
The aggregate behavior must be consistent with that belief
Here we are looking for fixed points rather than best-response intersections
# Bisection needs only a continuous function and a sign-changing interval
function bisect_zero(h, left, right; tol=1e-10, maxiter=200)
    f_left, f_right = h(left), h(right)
    abs(f_left) < tol && return left
    abs(f_right) < tol && return right
    f_left * f_right > 0 && error("The interval does not bracket a root")

    for _ in 1:maxiter
        middle = (left + right) / 2
        f_middle = h(middle)
        (abs(f_middle) < tol || right - left < tol) && return middle

        if f_left * f_middle < 0
            right = middle
        else
            left, f_left = middle, f_middle
        end
    end
    return (left + right) / 2
end
bisect_zero (generic function with 1 method)# Scan [0,1] for brackets, then refine every crossing with bisection
function fixed_points(g; grid_size=4000, tol=1e-8)
xs = collect(range(0.0, 1.0; length=grid_size + 1))
gaps = g.(xs) .- xs
roots = Float64[]
for i in eachindex(xs)
abs(gaps[i]) < tol && push!(roots, xs[i])
end
for i in 1:(length(xs) - 1)
if gaps[i] * gaps[i + 1] < 0
h(n) = g(n) - n
push!(roots, bisect_zero(h, xs[i], xs[i + 1]))
end
end
sort!(roots)
unique_roots = Float64[]
for root in roots
(isempty(unique_roots) || abs(root - unique_roots[end]) > 1e-5) &&
push!(unique_roots, root)
end
return unique_roots
endfixed_points (generic function with 1 method)equilibria = fixed_points(g)
n_zero, n_L, n_H = equilibria
(; equilibria=round.(equilibria; digits=4),
critical_candidate=round(n_L; digits=4),
high_adoption=round(n_H; digits=4))(equilibria = [0.0, 0.1298, 0.7702], critical_candidate = 0.1298, high_adoption = 0.7702)Three Self-Consistent Stories
: consumers expect no network, so nobody joins
: consumers expect a modest network, and exactly that share joins
: consumers expect a large network, and a large share joins
All three satisfy the equilibrium equation
But equilibrium does not automatically mean stable
Which stories survive a small mistake in expectations?
Stability: Push the System, Then Watch
Imagine expected adoption is nudged slightly away from an equilibrium
If the next realized adoption moves back, the equilibrium is stable
If it moves farther away, the equilibrium is unstable
Locally, the slope of the response map gives the test:
Intuition first: a stable response dampens a small error; an unstable response amplifies it
function response_slope(n, p; a=0.1, b=1.0)
    raw_adoption = 1 - p / (a + b * n)
    (raw_adoption <= 0 || raw_adoption >= 1) && return 0.0
    return p * b / (a + b * n)^2
end

equilibrium_report = [
    (n=round(n; digits=4),
     slope=round(response_slope(n, p; a=a, b=b); digits=3),
     classification=abs(response_slope(n, p; a=a, b=b)) < 1 ? "stable" : "unstable")
    for n in equilibria
]
3-element Vector{@NamedTuple{n::Float64, slope::Float64, classification::String}}:
(n = 0.0, slope = 0.0, classification = "stable")
(n = 0.1298, slope = 3.786, classification = "unstable")
(n = 0.7702, slope = 0.264, classification = "stable")Let Expectations Update
Give consumers yesterday’s adoption as today’s expectation
The update rule is deliberately simple:
function adoption_path(n0, g; periods=25)
    path = zeros(periods + 1)
    path[1] = n0
    for t in 1:periods
        path[t + 1] = g(path[t])
    end
    return path
end

starting_points = [0.05, 0.12, 0.14, 0.50, 0.95]
paths = hcat([adoption_path(n0, g) for n0 in starting_points]...)
26×5 Matrix{Float64}:
0.05 0.12 0.14 0.5 0.95
0.0 0.0909091 0.166667 0.666667 0.809524
0.0 0.0 0.25 0.73913 0.780105
0.0 0.0 0.428571 0.761658 0.772754
0.0 0.0 0.621622 0.767889 0.77084
0.0 0.0 0.722846 0.769556 0.770337
0.0 0.0 0.756941 0.769998 0.770204
0.0 0.0 0.766612 0.770114 0.770169
0.0 0.0 0.769216 0.770145 0.77016
0.0 0.0 0.769908 0.770153 0.770157
0.0 0.0 0.770091 0.770155 0.770156
0.0 0.0 0.770139 0.770156 0.770156
0.0 0.0 0.770152 0.770156 0.770156
0.0 0.0 0.770155 0.770156 0.770156
0.0 0.0 0.770156 0.770156 0.770156
0.0 0.0 0.770156 0.770156 0.770156
0.0 0.0 0.770156 0.770156 0.770156
0.0 0.0 0.770156 0.770156 0.770156
0.0 0.0 0.770156 0.770156 0.770156
0.0 0.0 0.770156 0.770156 0.770156
0.0 0.0 0.770156 0.770156 0.770156
0.0 0.0 0.770156 0.770156 0.770156
0.0 0.0 0.770156 0.770156 0.770156
0.0 0.0 0.770156 0.770156 0.770156
0.0 0.0 0.770156 0.770156 0.770156
0.0 0.0 0.770156 0.770156 0.770156plot(
0:25, paths;
label=permutedims(["n₀ = $n0" for n0 in starting_points]),
xlabel="Expectation-update step",
ylabel="Adoption",
ylims=(0, 1),
title="A small difference around the threshold becomes a large one",
)
hline!([n_L n_H]; label=[L"unstable $n_L$" L"stable $n_H$"], linestyle=[:dot :dash], color=[:red :black])Reveal: The Middle Equilibrium Is a Threshold
The middle equilibrium is unstable
Start just below it and adoption spirals toward zero
Start just above it and adoption snowballs toward
We call this threshold critical mass
Crossing critical mass can lead to tipping: self-reinforcing movement toward high adoption
This is why “build it and they will come” can fail
A good product below critical mass can still die
Expectations and initial participation are economic inputs, not background details
Picture a ball balanced just to the right of on a stability landscape: which valley does it roll into?
The figure below draws that landscape and shows the answer
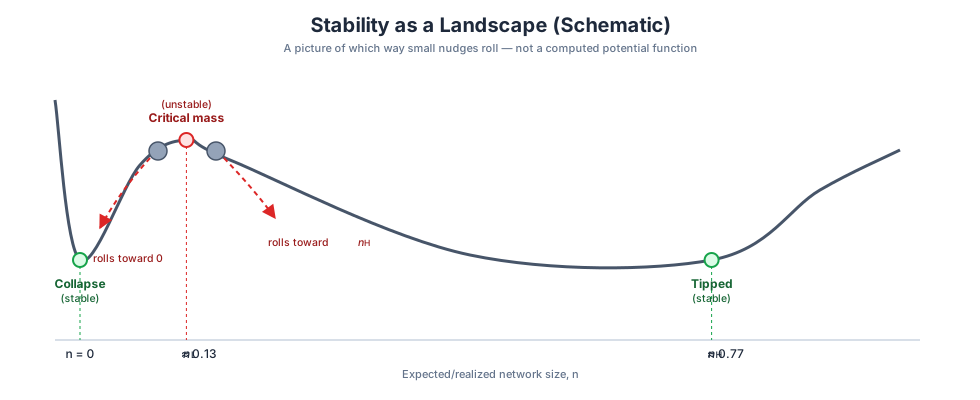
Figure 3:The middle equilibrium is a hilltop: nudge adoption slightly below it and the system rolls toward collapse at ; nudge it slightly above and the system rolls toward the tipped equilibrium . The curve is a schematic of stability, not a computed potential function.
The Chicken-and-Egg Problem
Diners will not carry a card that few restaurants accept
Restaurants will not accept a card that few diners carry
Riders want drivers before opening the app; drivers want riders before going online
This is the platform chicken-and-egg problem
Diners Club’s answer was to make the card roughly free for cardholders
The giveaway was not generosity—it helped move one side toward critical mass
Price Structure Is Not Price Level
A platform chooses a price for each side
Price level asks how much the platform collects in total
Price structure asks which side pays how much
Moving one dollar of the fee from diners to restaurants can change participation even if total fees stay fixed
Why? Each side creates a cross-side externality for the other
Multihoming—using more than one platform—will further change how strongly each side can be charged
We will derive that pricing logic in Platform Pricing
Comparative Statics: Lower the Price
Our model gives a direct prediction
Lower price means more consumers join at any expected network size
Graphically, the realized-adoption curve shifts upward
The unstable intersection moves left: critical mass shrinks
At a sufficiently low price, even a tiny initial network begins to grow
Let us compute the threshold across prices rather than trust the picture
function critical_mass(price; a=0.1, b=1.0)
    response(n) = realized_adoption(n, price; a=a, b=b)
    roots = fixed_points(response)
    unstable = [
        n for n in roots
        if response_slope(n, price; a=a, b=b) > 1 + 1e-6
    ]
    return isempty(unstable) ? 0.0 : minimum(unstable)
end

prices = range(0.10, 0.30; length=81)
thresholds = [critical_mass(price; a=a, b=b) for price in prices]
81-element Vector{Float64}:
0.0
0.0027864044904708867
0.005590279132127762
0.008411956697702408
0.011251780629158019
0.014110105633735657
0.016987298101186755
0.019883736640214922
0.02279981273412705
0.02573593127727508
0.028692511349916454
0.03166998672485352
0.034668806850910186
⋮
0.27679491925239563
0.2841687605381011
0.2918861169815063
0.3
0.30857864379882816
0.3177124342918396
0.3275255126953125
0.33819660115242
0.35
0.36339745950698854
0.37928932189941406
0.4plot(
prices, thresholds;
label="critical mass",
xlabel="Price p",
ylabel=L"Unstable threshold $n_L$",
title="Lower prices shrink the launch threshold",
color=:darkorange,
)
scatter!([p], [n_L]; label="baseline", color=:black, markersize=6)Exercise 3: Classify Four Platforms
For each platform below, identify one same-side effect and one cross-side effect
Label every effect positive or negative:
Credit cards: cardholders and merchants
Ride-share: riders and drivers
Multiplayer gaming: players and game developers
Ad-supported social media: users and advertisers
Your ride-share answer must include at least one negative same-side effect
Which platform has the strongest case for subsidizing one side? Explain
Exercise 4: A Different Network-Value Function
Replace the linear network value with
Set and reuse
fixed_pointsReport:
The number of fulfilled-expectations equilibria on
The adoption level of each equilibrium
Which equilibrium is the critical mass
Classify stability by iterating from just above and just below each interior equilibrium
f_sqrt(n) = sqrt(n)
p_sqrt = 0.1

# TODO: define realized adoption g_sqrt(n), remembering to clamp to [0,1]
# TODO: call fixed_points(g_sqrt) and report the equilibria
# TODO: iterate from values just above and below the interior equilibria0.1Exercise 5: Subsidize Early Adopters
Suppose the platform temporarily sets : early adopters are paid to join
Before computing, predict what happens to critical mass
Then modify the baseline model and compare , , and
Does our clamped demand model predict partial adoption or immediate full adoption under a subsidy?
What real-world friction is missing if the prediction seems too strong?
Connect your answer to why platforms offer referral bonuses, free trials, or rewards
subsidy_prices = [-0.05, 0.0, 0.05]

# TODO: create one realized-adoption curve for each price
# TODO: plot the curves against the 45-degree line
# TODO: explain what happens to the chicken-and-egg problem
3-element Vector{Float64}:
-0.05
0.0
0.05Takeaways
Platforms are matchmakers: they create value by connecting distinct groups
Same-side network effects operate within a group; cross-side network effects operate across groups
Fulfilled-expectations equilibria require expected adoption to equal realized adoption
Multiple equilibria make history and expectations matter
The unstable middle equilibrium is critical mass
Below critical mass, adoption can collapse; above it, feedback can produce tipping
Subsidizing one side can be a rational response to the chicken-and-egg problem
Next Time
We have identified the threshold, but not how a real platform crosses it
Next time: how do platforms actually ignite?
We’ll simulate the race to critical mass—and see the winner isn’t always the better platform